
- 1. Mobile/Web App for Data Capture
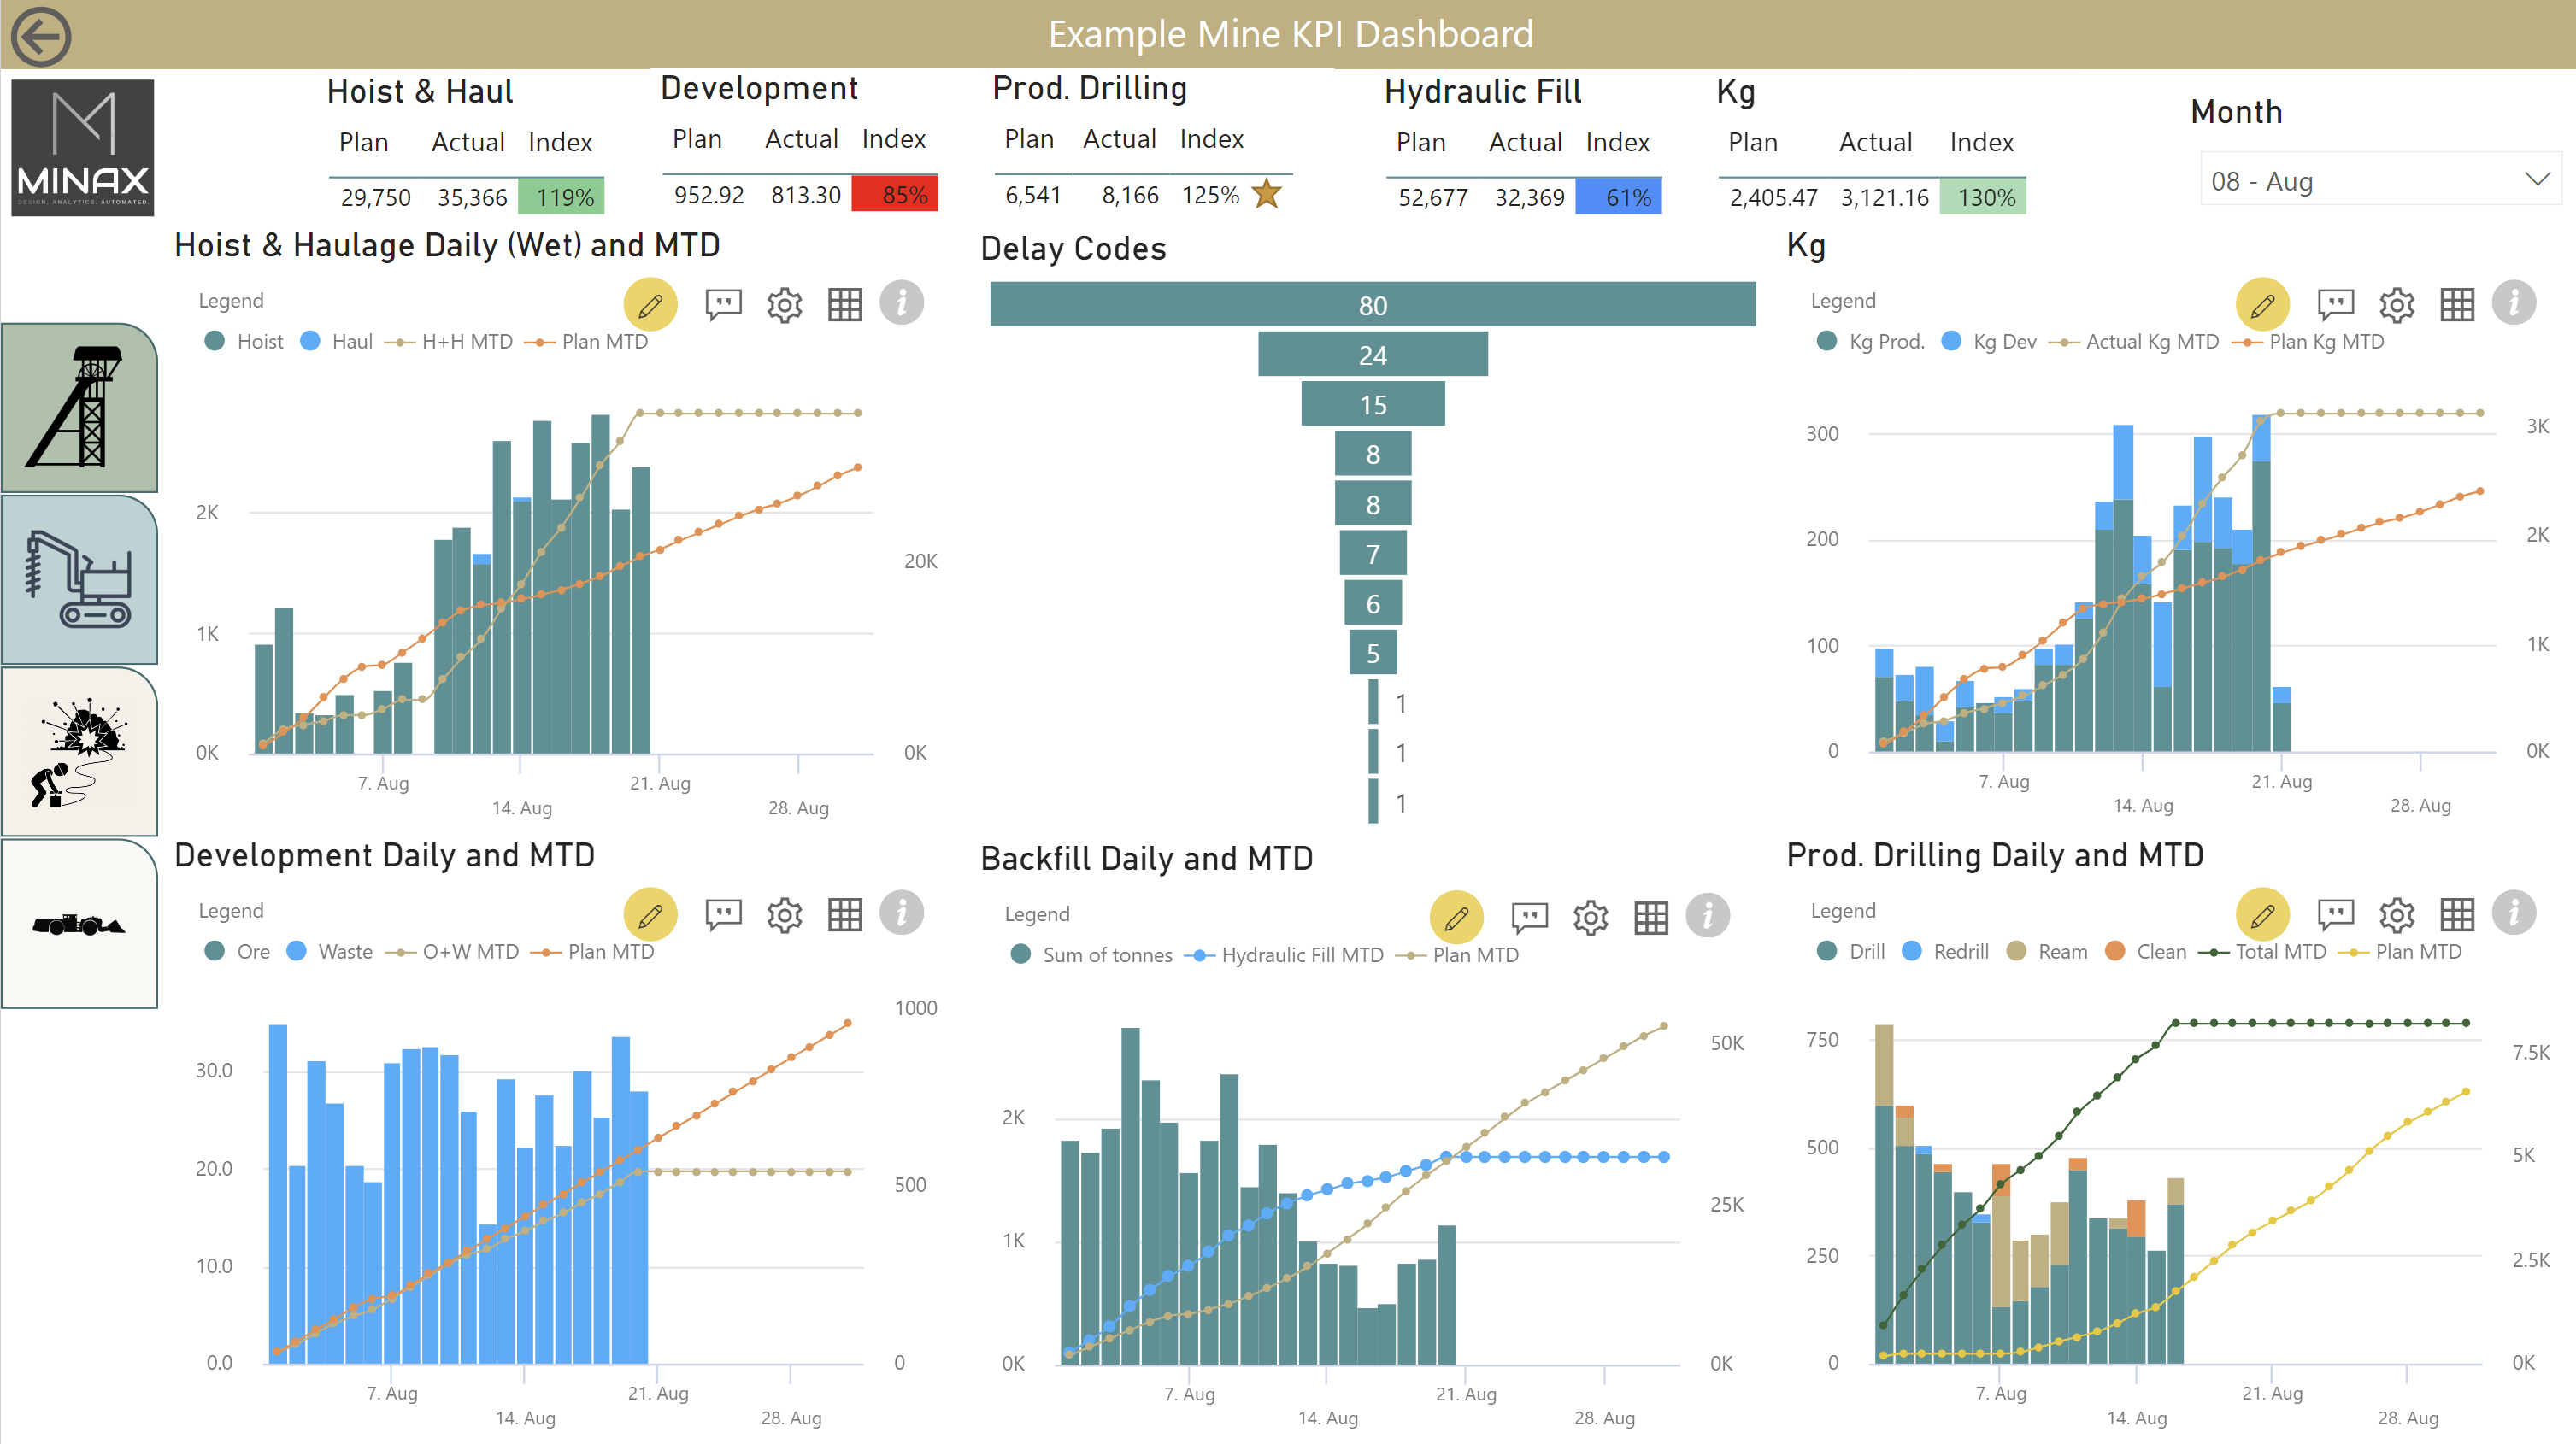
- 2. Dashboard with KPIs
- 3. Report Visuals
- 4. Metrics with Notes
The Course Curriculam
Power BI for Mine Metrics Description
As an essential tool to gauge the health of the operation, a mine metrics report is often built within Microsoft Excel with data sourced from various department files. The engineering team updates the data and sends a PDF/Excel report by email to their leadership. Often this format can be inefficient and difficult to view on mobile devices, and often time consuming. Through this short course, attendees are introduced to Power BI, a tool intended to make data reporting and consumption streamlined and mobile-friendly. Attendees will learn how to bring their existing mine production data into Power BI and get hands-on experience in making charts and cards to present mine KPIs in a visually informative manner. Finally, attendees can expect to automate the data fetch process and distribute the report on a defined schedule, and in return creating a more efficient and streamlined approach to mine metrics reporting. As a bonus to the CIM attendees, this course will demonstrate how to fully automate the source data refresh of your organization's network drives while also creating a mobile-native dashboard for ease of use on mobile devices.
Top Takeaways
- Understanding the key differences and advantages of both the traditional (Excel) way and the Power BI way
- Understanding of the general workflow from source data to final report
- Gaining hands-on experience of developing a mine metrics report in Power BI for interactive self-service data consumption (both on PC and on mobile)
- Efficiently automating routine work through Power Automate
- Free sample reports for customization to suit your business scenarios
Short Course Objectives
- Learn the basic use of Power BI
- Gain hands-on experience in linking various production data sources for automated reporting
- Understand data transformation techniques
- Set up robotic routines to automatically refresh data with minimal manual intervention
- Use metrics and goals to track high-level progress
- Share data and report to target audience at given frequency
Who Would Benefit from This Course
Mine Technical Services Personnel, Metrics Engineers, Mine Superintendents and Managers, IT Business Partners, Data and Reporting Analysts and Specialists, Digital Transformation Personnel and People with Interest in Data Analysis
Requirements
Participants are required to bring their own laptop with the admin rights or a laptop with Power BI for Desktop and Power Automate installed.
Description
The "Power BI for Mine Metrics Course" is a specialized training program aimed at mining industry professionals. It teaches how to effectively use Power BI for analyzing and visualizing key metrics and data relevant to mining operations. Participants learn data extraction, transformation, visualization design, and best practices for mining-specific KPIs, enabling better decision-making and process optimization.
What Will You Learn?
- 1. History
- 2. Successful Case Studies
- 3. User Interface
- 4. Computer Setup (VM if no Power BI installed and no admin rights to install)
- 1. Tonnage to Surface
- 2. Primary Haulage
- 3. Production Drilling
- 4. Backfilling
- 5. Development Metres
- 6. Missed Rounds
- 7. Inventory
- 8. Bonus: Deswik Schedule to Database
- 9. Bonus: On-prem File Server
- Power Automate
- Data Gateway
- 1. Data Import
- 2. Data Transformation
- 1. Author column calculations
- 2. Author measure calculations
- 1. Native Visuals
- 2. Custom Visuals
- 1. Data Credentials and Refresh
- 2. Set Up Distribution of Report
- 3. Navigate on PowerBI.com for Self-service
- 1. Copilot
- 2. Anomaly Detection
- 3. Smart narratives
- 4. Q&A visuals
- 5. Key influencers
- 1. Build Dashboard
- 2. Mobile Access
- 3. Set Up Goals for Alerting
- 1. Deployment Pipeline
- 2. Error Notifications
- 3. Security and Access
- 1. Performance analyzer
- 2. Filter query
- 1. Introduction to Figma
- 2. Connect app to data sources (OneDrive, SharePoint, SQL, etc.)
- 3. Publish and share app
- 4. Connect Power BI to app data

Sihong P.
Empower Mining Professionals via Digitization and Automation
Greater Sudbury, Ontario, Canada
Contact info
678 followers · 500+ connections
About the instructor
Sihong has worked in the mining industry since 2011 with a wide range of experience including surveying, ventilation, ground control, geology, development planning, production planning, mine design and scheduling, and business intelligence. He has always been interested in process improvement through automation. Prior to founding Minax Inc., a consulting business focusing on helping mining operations with their digitalization efforts, Sihong assumed the role of Superintendent - iROC Data and Governance at Vale’s iROC where he led the development and implementation of multiple digital solutions and Power BI reports that automate data transmission near real-time to mine site leadership and other stakeholders in a digital format. Sihong is a certified professional engineer in the province of Ontario. He has also received the data science certificate from University of Toronto and University of Waterloo. Sihong received his Master of Applied Science degree in mineral resources engineering from Laurentian University in Canada and his Bachelor of Science degree in information and computation science from Wuhan University of Technology in China.